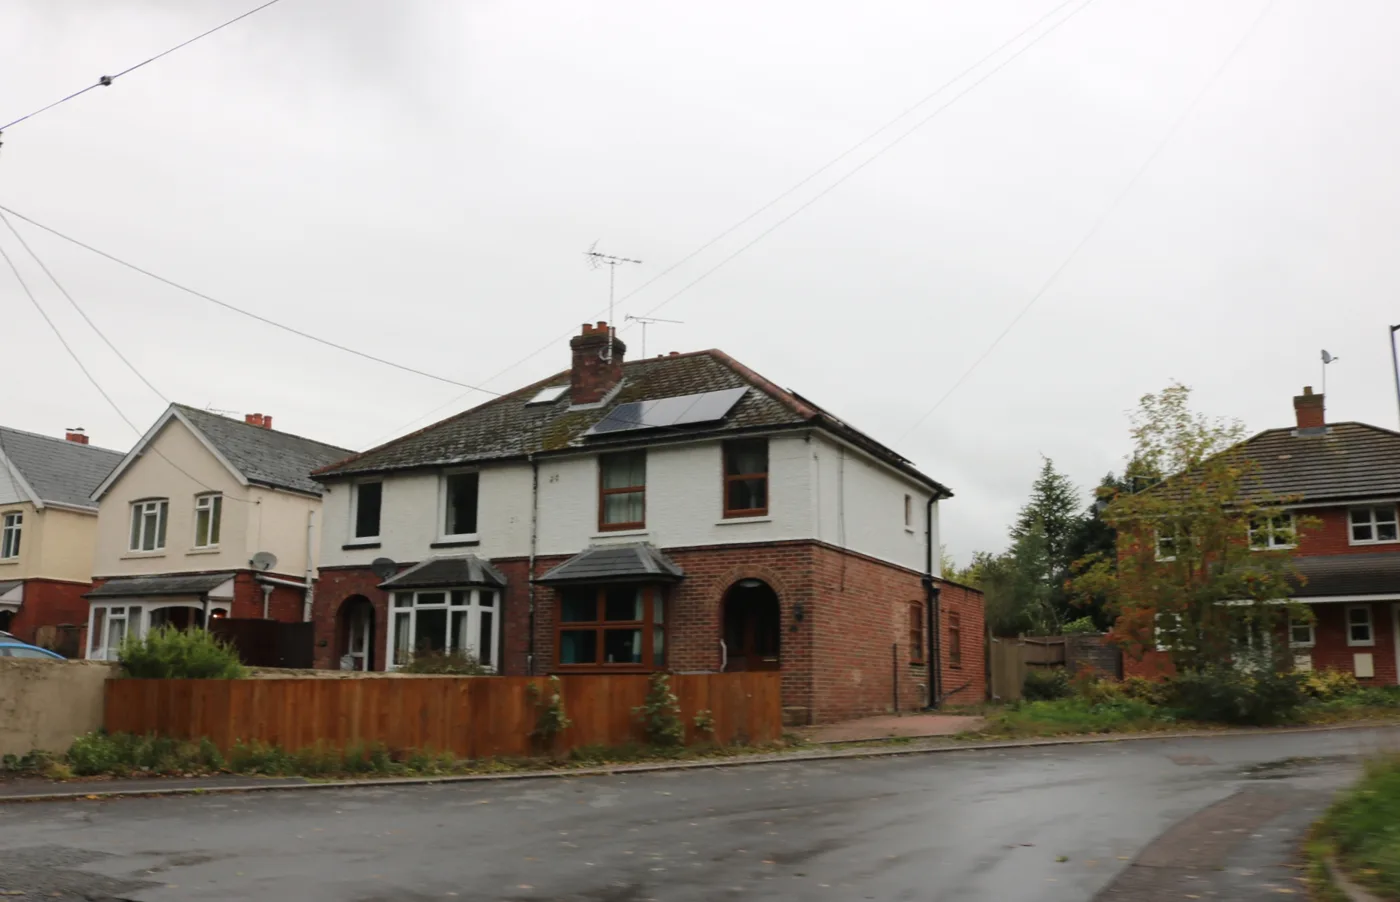

The middle Andover home sold for £280,000 in the year to June 2026, the cheapest median in Test Valley. Sector by sector, from Land Registry records.
Asking prices in agents’ windows are hopes. The number that counts is what homes actually change hands for, and every completed sale in England and Wales is recorded by HM Land Registry and published. This page reads those records for Andover and the rest of Test Valley: the headline average, how it splits by property type, and what the middle home sold for in each postcode.
One thing to fix before the numbers. The official house price index is published for the whole Test Valley borough, and Test Valley is an unusual shape: a long thin district with two towns twenty miles apart. Andover sits at the north end facing Basingstoke and Salisbury. Romsey sits at the south end and is functionally a Southampton commuter town. They share a council and almost nothing else, and the borough average sits between them, describing neither. The second half of this page splits them.
The headline figure
The average home in Test Valley sold for £370,329 in May 2026, the most recent month published in the UK House Price Index. That is up 0.5% over the year.
Put that against the borough’s own record and the market is still behind it. Test Valley peaked at £388,788 in September 2023. Two and a half years later the average is £18,459, or 4.7%, below that peak.
Put it against the neighbours and 0.5% looks thin. Over the same twelve months Winchester rose 3.1% and England rose 2.3%. The one comparison that flatters Test Valley is the one immediately to the east: Basingstoke and Deane fell 2.9%.
What it means for you
If you are buying, prices here are close to flat, so there is no penalty for taking a few months over it. The useful lever is geography, and in this borough geography is worth more than in most: the gap between the cheapest and dearest postcode below is £325,000.
If you are selling, a 2023 price is optimistic. The average is still 4.7% below the September 2023 peak in cash terms, and further below once inflation is allowed for. Flats are the weak spot, down 2.3% over the year and the only category falling.
If you are staying put, your home is worth roughly what it was last summer, and a little less than it was in autumn 2023.
Prices by property type
The average hides a wide spread. These are borough averages for May 2026 from the UK House Price Index, with the annual change alongside:
- Detached houses: £604,361, up 0.2%. Nearly flat, and because detached homes carry the borough average, that is most of the reason the headline barely moved.
- Semi-detached houses: £359,272, up 1.7%. The strongest riser.
- Terraced houses: £284,215, up 1.3%.
- Flats and maisonettes: £171,585, down 2.3%. The only category falling, and the cheapest flats of any Hampshire district in this comparison.
The same data splits buyers rather than buildings. A first-time buyer in the borough paid an average of £284,744 in May 2026, up 0.6%. A home mover paid £451,058, up 0.5%. The £166,314 between those two figures is the size of the step from a first flat or terrace to a family house here.
What each part of the borough actually sells for
This is where the borough average stops being useful.
The table below is our own analysis of 1,647 residential sales in Test Valley that completed between 1 July 2025 and 30 June 2026, taken from HM Land Registry Price Paid data and filtered to sales recorded in the Test Valley district. It shows the median price, the middle sale, which is less distorted by one enormous house than an average is. The borough median over that period was £350,301.
A note on the postcodes. Test Valley’s boundary does not follow postal towns, so several outcodes below carry a post town outside the borough while the properties themselves sit inside it. Only the Test Valley sales are counted, which is why some outcodes show very few.
| Postcode area | Main places | Median sold price | Sales |
|---|---|---|---|
| SP5 | The far western fringe (Salisbury post town) | £650,000 | 10 |
| SO20 | Stockbridge, Kings Somborne, Broughton | £605,000 | 77 |
| SO53 | Valley Park and Chandler's Ford edge (Eastleigh post town) | £430,000 | 110 |
| SO16 | Nursling, Rownhams (Southampton post town) | £427,500 | 73 |
| SO51 | Romsey and its villages | £410,000 | 403 |
| SP11 | The Andover villages: Weyhill, Clatfords, Longparish, Chilbolton | £360,000 | 332 |
| SO52 | North Baddesley | £352,500 | 97 |
| SP9 | Tidworth edge (Wiltshire post town) | £320,000 | 14 |
| SP10 | Andover town | £280,000 | 524 |
Andover on its own
Take the two Andover outcodes together, SP10 and SP11, and there were 856 sales in the year to June 2026 at a median of £313,750. That is £36,551 below the borough median and nearly £100,000 below Romsey.
Split them and the gap opens further. SP10, the built-up town, had a median of £280,000 across 524 sales. SP11, the villages ringing it, came in at £360,000 across 332. Living four miles out of Andover costs £80,000 more than living in it.
The town then splits five ways by postcode sector:
| Sector | Roughly | Median | Sales |
|---|---|---|---|
| SP11 7 | West towards Weyhill, Amport and Thruxton | £470,000 | 49 |
| SP11 8 | Weyhill, Appleshaw and the Wiltshire edge | £445,000 | 33 |
| SP11 0 | East towards Longparish and Hurstbourne | £400,000 | 25 |
| SP11 6 | The southern villages: Upper and Goodworth Clatford, Abbotts Ann | £336,000 | 217 |
| SP10 2 | North and east: Charlton, Smannell Road, King Arthurs Way | £305,000 | 166 |
| SP10 3 | West: Weyhill Road, Harrow Way, Upper Drove | £297,475 | 164 |
| SP10 4 | South east: Picket Twenty and the London Road side | £290,000 | 76 |
| SP10 5 | South: Winchester Road and the Anton valley | £250,000 | 58 |
| SP10 1 | Town centre: High Street, New Street, Junction Road, Old Winton Road | £232,500 | 60 |
Why Andover is cheap, and why it is not just the mix
The usual explanation for a low town median is the mix: town centres sell flats, villages sell detached houses, and a median mixes them together. That is part of the story here. Terraced houses were 198 of SP10’s 524 sales, and flats another 107. Between them, 58% of everything sold in Andover town was a terrace or a flat. Detached houses were 18%.
But the mix is not the whole answer, and this is the finding that matters if you are choosing between Andover and Romsey. Compare like with like and Andover is still cheaper in every single category:
| Area | Detached | Semi-detached | Terraced | Flat |
|---|---|---|---|---|
| SP10 Andover town | £465,000 | £325,000 | £260,000 | £157,000 |
| SP11 Andover villages | £501,250 | £340,000 | £312,000 | £190,000 |
| SO51 Romsey | £630,000 | £405,000 | £330,000 | £215,000 |
| Test Valley borough | £560,500 | £347,250 | £290,000 | £180,000 |
A detached house in Andover town costs £165,000 less than the same category in Romsey. A semi costs £80,000 less, a terrace £70,000 less and a flat £58,000 less. That is a real discount on the same kind of building, not an artefact of counting.
Two things drive it. Andover’s housing stock is younger and denser than Romsey’s, built out through the 1960s and 1970s under the London overspill expansion scheme, so there is far more of it and much less of it is period. And Romsey is twenty minutes from Southampton with a faster commuter market attached, while Andover looks north to Basingstoke, where prices themselves fell 2.9% over the year.
On individual streets with at least five recorded sales in the year, the highest medians in Andover were Winchester Road (£620,000) and Anton Road (£527,000). At the other end, Kingsway Gardens came in at £77,000 and New Street at £148,000, both flat-heavy addresses, with Old Winton Road at £162,500 across 18 sales, the busiest low-priced street in the town.
How Test Valley compares
| Area | Average price | Annual change |
|---|---|---|
| Winchester district | £476,639 | +3.1% |
| South East region | £381,311 | +1.2% |
| Test Valley borough | £370,329 | +0.5% |
| Basingstoke and Deane | £366,291 | -2.9% |
| Hampshire county | £362,998 | +0.8% |
| England | £292,095 | +2.3% |
Test Valley sits just above the Hampshire average and just below the South East average, which makes it look thoroughly average. It is not. The borough figure is an average of Stockbridge at £605,000 and Andover at £280,000, and hardly anyone lives at the midpoint.
Frequently asked questions
What is the average house price in Andover?
The official index covers the whole Test Valley borough, where the average home sold for £370,329 in May 2026. On completed sales in the year to June 2026, the median across the two Andover postcodes, SP10 and SP11, was £313,750, made up of £280,000 in the town (SP10) and £360,000 in the surrounding villages (SP11).
Are Andover house prices going up or down?
Slightly up. Test Valley prices were up 0.5% in the year to May 2026, against 3.1% in Winchester and 2.3% across England. The borough average is still 4.7% below its September 2023 peak of £388,788. Flats are the exception, down 2.3%.
Why is Andover cheaper than Romsey?
Both, and the second reason surprises people. Andover sells more terraces and flats, which pulls a median down. But it is also cheaper like for like: a detached house in Andover town had a median of £465,000 against £630,000 in Romsey, and the same gap holds for semis, terraces and flats. Andover’s stock is younger and denser after the 1960s expansion scheme, and Romsey has a Southampton commuter market that Andover does not.
Which part of Andover is cheapest?
SP10 1, the town centre, at a median of £232,500 across 60 sales. The dearest Andover sector is SP11 7 out towards Weyhill and Thruxton, at £470,000. Within the built-up town, SP10 2 north and east leads at £305,000.
How much is a detached house in Andover?
The borough average for a detached house was £604,361 in May 2026. On completed sales, the median detached house in SP10 was £465,000 and in SP11 £501,250.
Where can I check what a specific house sold for?
Every completed sale in England and Wales is public. Search a street or address for free on the HM Land Registry Price Paid service.
Related
- Andover train times to London and what a season ticket costs, which is the other half of the cost of living here.
- Andover planning news: the 934 homes a year the borough is now required to find, and why the Local Plan has restarted.
- Andover roadworks, parking and travel.
Sources
- UK House Price Index, Test Valley (ONS and HM Land Registry) for the borough average, property-type and buyer-type figures and the annual changes.
- HM Land Registry UKHPI open data for the May 2026 record, and the matching Hampshire, Winchester, Basingstoke and Deane, South East and England benchmarks. The September 2023 peak comes from the same series.
- HM Land Registry Price Paid data for the postcode, sector, street and property-type medians, computed from 1,647 residential sales recorded in the Test Valley district completing between 1 July 2025 and 30 June 2026.
Land Registry figures are provisional and revised as more sales are registered. Confirm the latest numbers against the linked sources before making a decision.
Have your say