
320 people aged 18 to 24 were claiming in August, the most since 2021 and up 25.5% in a year. No Hampshire district rose faster, and the total barely moved.
There were 320 people aged 18 to 24 claiming unemployment-related benefits in Test Valley in August. No month has been higher since August 2021.
The figure is up from 255 in August last year, a rise of 25.5%. That is the steepest increase of any of the eleven Hampshire districts, and it is the second month running that Test Valley has topped that table. (ONS claimant count via nomis)
The borough’s overall claimant count was 1,610, or 2.0% of residents aged 16 to 64. A year ago it was 1,555. The headline has barely moved, which is exactly why the age split is worth reading.
Here is the August 2026 borough total broken down:
- 18 to 24: 320, up from 255 a year ago, a rise of 65
- 25 to 49: 875, down from 910, a fall of 35
- 50 and over: 415, up from 385, a rise of 30
One group rising sharply while a larger group falls is what keeps the total flat. Under-25s are now close to one in five of all claimants in the borough. A year ago they were about one in six.
No Hampshire district rose faster
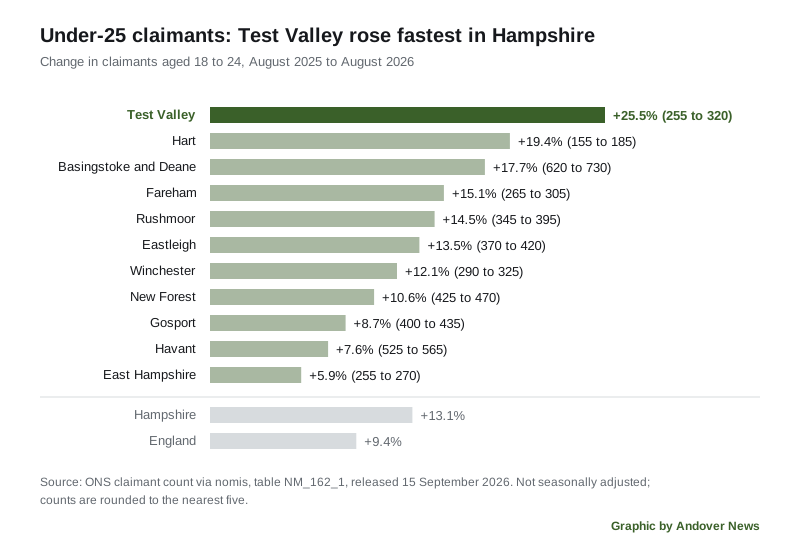
Test Valley’s 25.5% is nearly double the Hampshire figure and nearly triple England’s. Across Hampshire, 18 to 24 claimants went from 3,905 to 4,415, a rise of 13.1%. In England they went from 269,925 to 295,410, a rise of 9.4%.
Only East Hampshire, at 5.9%, rose by less than a tenth.
The highest count since 2021, but not the highest ever
Test Valley’s 18 to 24 count has been climbing for a year. It sat at 255 in August 2025, reached 295 by October, and has been at 290 or above every month since.
August 2026’s 320 matches August 2021 exactly, and no month between the two has been higher. The peak of 315 in February, March and April this year came closest.
The comparison that puts it in context is further back. In August 2019, before the pandemic, Test Valley had 185 claimants aged 18 to 24. The count then went to 620 by July 2020 and fell back through 2021 and 2022, bottoming out at 210 in April 2022. It has risen by more than half since. (Seven-year series for Test Valley)
The borough is still one of the lowest in Hampshire overall
On the headline rate, Test Valley remains near the bottom of the county table. Its 2.0% of working-age residents is matched by Fareham, and only Hart is lower at 1.8%. Gosport is highest at 3.6%, followed by Havant at 3.3% and Rushmoor at 3.0%.
So this is not a story about a borough in trouble. It is a story about one age group inside a borough that is otherwise doing well on this measure.
A note on last month’s figure
ONS revises the previous month with each release. July’s Test Valley total has been revised down from 1,605 to 1,585, and the July 18 to 24 count from 310 to 305. We reported the original figures on 21 August. On the revised numbers, July’s annual rise for under-25s was 19.6% rather than 21.6%, and Test Valley was still the steepest in Hampshire.
What the figure is, and what it is not
This is not the unemployment rate, and the difference matters.
- The ONS says the claimant count “is a measure of the number of people claiming benefits principally for the reason of being unemployed, based on administrative data from the benefits system”.
- It “does not attempt to measure unemployment, which is a concept defined by the International Labour Organisation (ILO) as all those who are out of work, actively seeking work and available to start work”.
- It combines Jobseeker’s Allowance with Universal Credit claimants “who are required to seek work to qualify for their benefits”, so it includes some people who are working but on low earnings.
- The band is 18 to 24, so 16 and 17 year olds are not counted in it, and most people in full-time education are not counted at all.
- The count date is the second Thursday of each month, which for these figures was 13 August.
- Local figures are not seasonally adjusted, which is why every comparison here is August against August.
- Counts are rounded to the nearest five, so the age bands will not always add exactly to the total.
(ONS claimant count quality and methodology information)
There is one thing this table cannot tell you. ONS does not publish a claimant rate broken down by age, because the proportions are only available when the figures are not split by age. So there is no way to say what share of Test Valley’s under-25s are claiming, only how many.
What it means for you
If you are 18 to 24 and out of work in Andover or Romsey, you are part of a group that has grown by 65 people in a year, which means the local competition for entry-level jobs is tighter than it was. Two free national services are the starting points: Find a job for vacancies, and the National Careers Service for advice and skills funding.
If you run a business here, the same figures read the other way. There are more young people locally looking for a first job than at any point since 2021. Test Valley Borough Council also runs its own grants for businesses taking on premises and expanding, which we have covered here and here. (Business grants and support)
If you follow the numbers, the next monthly release is on 20 October 2026, and it will carry the September figures. September and October are the months when school and college leavers who did not go on to further study start to appear, so they are the ones to watch. (ONS, Jobs and vacancies in the UK)
Sources
- ONS claimant count, table NM_162_1 via nomis, released 15 September 2026, for every figure in this article. Test Valley is local authority E07000093.
- Hampshire districts, 18 to 24 claimants, August 2025 and August 2026.
- Test Valley, 18 to 24 claimants, monthly since August 2019.
- ONS claimant count quality and methodology information, for the definitions, the count date and the rounding rule.
Our July report: Test Valley under-25 claimants rise fastest in Hampshire. Also on the local economy: Test Valley house prices and Andover house prices.
Have your say