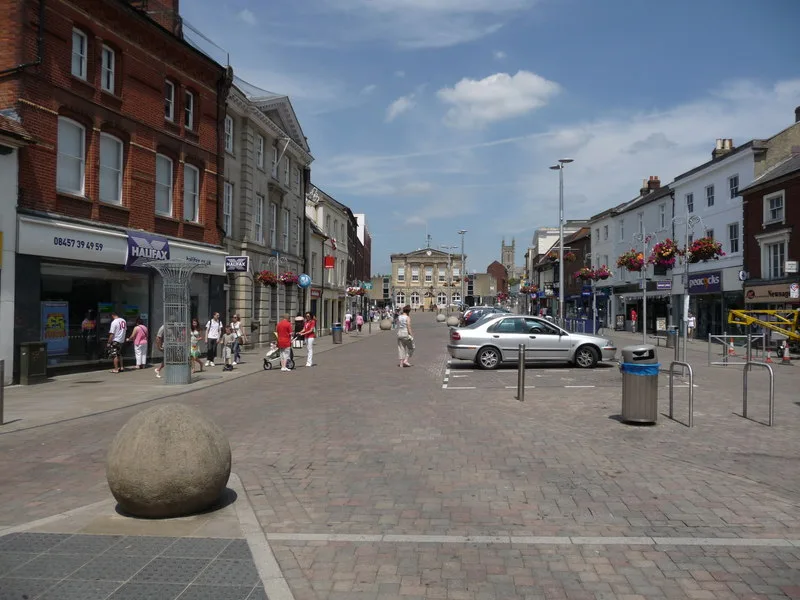

310 people aged 18 to 24 were claiming in Test Valley in July, up 21.6% in a year: the steepest rise of any Hampshire district. The borough total barely moved.
The number of under-25s claiming unemployment-related benefits in Test Valley rose faster last year than in any other Hampshire district.
There were 310 claimants aged 18 to 24 in the borough in July 2026, against 255 in July 2025. That is a rise of 55 people, or 21.6%. (ONS claimant count by sex and age, via nomis)
Across the eleven districts of Hampshire, the one-year change in that age group ran like this:
- Test Valley, up 21.6% (255 to 310)
- New Forest, up 20.5% (390 to 470)
- Hart, up 19.4% (155 to 185)
- Basingstoke and Deane, up 17.8% (590 to 695)
- Eastleigh, up 16.2% (340 to 395)
- Winchester, up 13.5% (260 to 295)
- Rushmoor, up 12.1% (330 to 370)
- Gosport, up 10.5% (380 to 420)
- Havant, up 8.6% (525 to 570)
- East Hampshire, up 8.0% (250 to 270)
- Fareham, up 7.8% (255 to 275)
Hampshire as a whole rose 13.9%, from 3,735 to 4,255. England rose 9.4%. Test Valley’s increase is more than twice the national rate.
The headline number hides all of it
Anyone reading only the borough total would conclude that nothing much happened. Test Valley’s claimant count across all ages was 1,605 in July 2026. A year earlier it was 1,570. That is an increase of 35 people, or 2.2%, and the rate held at 2.0% of residents aged 16 to 64.
Hampshire’s all-age count rose 3.4% over the same year. England’s rose 1.1%. On that measure Test Valley looks unremarkable.
The age breakdown says something different. Only the youngest group grew sharply, and two mid-career groups fell enough to cancel most of it out.
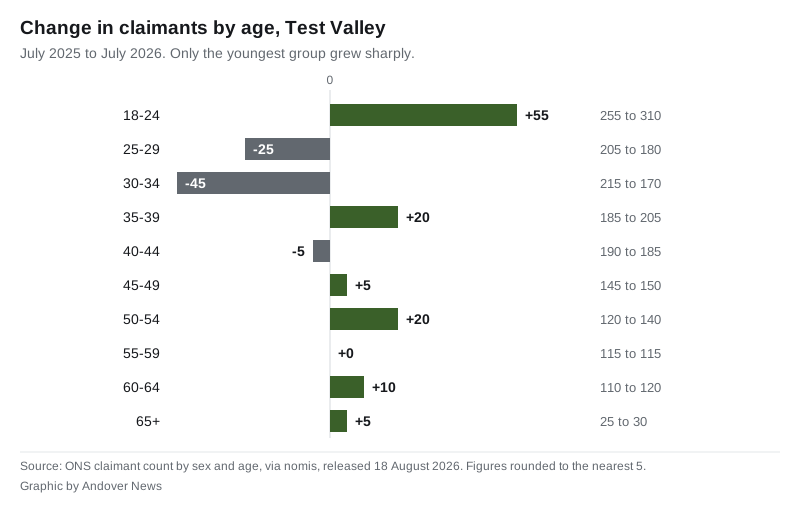
The 25 to 29 band fell by 25 people and the 30 to 34 band by 45. Between them that is 70 fewer claimants in their late twenties and early thirties, set against 55 more under-25s. The other seven bands moved by 20 people or fewer each.
Put another way, under-25s were 19.3% of all Test Valley claimants in July, up from 16.2% a year earlier. Roughly one claimant in five is now under 25, in a group that covers only seven years of the working-age range.
The two-year picture is steeper still. In July 2024 there were 230 claimants aged 18 to 24 in the borough. The figure has risen by 80 since, an increase of 34.8%.
Of the 310 in July, 180 were men and 130 were women. Both rose over the year, from 150 and 105 respectively.
What the claimant count does and does not measure
This matters before anyone reads too much into it. The claimant count is not the unemployment rate, and the ONS is explicit that it does not try to be. It counts people on Jobseeker’s Allowance plus people on Universal Credit who are required to look for work as a condition of their claim. (ONS, Claimant Count methodology)
Four things follow from that, and all four apply to the figures above:
- Some people in the count are working. Universal Credit requires a broader group to seek work than Jobseeker’s Allowance did, including some people in low-paid or part-time jobs.
- 16 and 17 year olds are largely excluded, as are most people in full-time education. The 310 is an 18 to 24 figure, and it does not include students.
- The numbers are rounded to the nearest five, so the age bands do not always add up exactly to the published total.
- The latest month is provisional and can be revised. These figures were released on 18 August 2026.
Every comparison on this page is July against July. That is deliberate: it removes the seasonal swing, which matters because school and college leavers reach the labour market at the same point every summer.
One more timing point. A July snapshot was taken before this month’s GCSE and A-level results. Whatever this year’s leavers do next will show up in the autumn figures, not these.
What it means for you
If you are 18 to 24 and looking for work in Andover, Romsey or the villages, the useful thing to know is that you are not an outlier. The local pattern is a real one, and it is sharper here than across Hampshire.
- Making a claim, or checking what you can get. Universal Credit is claimed through gov.uk. Being required to look for work as a condition of a claim is what puts someone into these figures.
- Careers advice, free. The National Careers Service has advisers you can speak to if you live in England. The line is 0800 100 900, open 8am to 8pm Monday to Friday and 10am to 5pm on Saturdays and bank holidays.
- Local business support. Test Valley Borough Council runs grants and business support for people starting up, including a £750 Business Incentive Grant for new full-time start-ups.
If you are an employer in the borough, the same figures read as supply. There are more young people available for work here than a year ago, and fewer people in their late twenties and early thirties.
For the wider local picture, our Andover house prices page tracks what homes actually sell for across Test Valley, and our Andover train times to London page covers the commute for anyone looking for work outside the borough.
Sources
- ONS claimant count by sex and age, via nomis, dataset released 18 August 2026, covering July 2026. Figures for Test Valley (E07000093), the other Hampshire districts, Hampshire and England.
- ONS, Claimant Count methodology
- ONS, Labour market overview, UK: August 2026, released 18 August 2026
Have your say