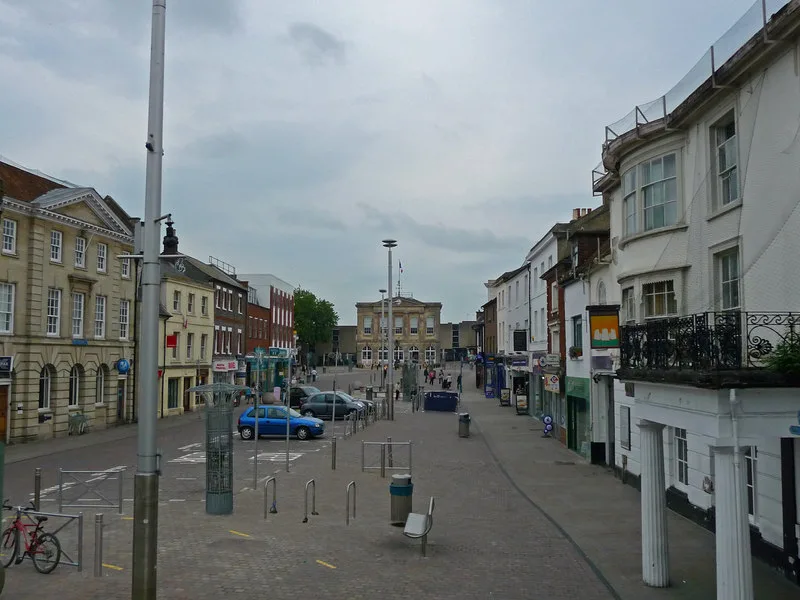

330 people aged 18 to 24 were claiming in Test Valley in September, the most since July 2021 and up 24.5% in a year, again the fastest rise in Hampshire.
There were 330 people aged 18 to 24 claiming unemployment-related benefits in Test Valley in September. That is the highest count since July 2021.
A year earlier the figure was 265, so it has risen by 65, or 24.5%. For the third month running, no Hampshire district has seen a faster rise in young claimants, though Hart came within half a point this time. (ONS claimant count via nomis)
The borough’s overall count was 1,610, or 2.0% of residents aged 16 to 64. A year ago it was 1,535. That is a rise of 4.9%, far slower than the rise among under-25s.
Here is the September 2026 total broken down by age:
| Age | September 2025 | September 2026 | Change |
|---|---|---|---|
| 18 to 24 | 265 | 330 | up 65 |
| 25 to 49 | 915 | 880 | down 35 |
| 50 and over | 355 | 395 | up 40 |
Under-25s now make up about one in five of the borough’s claimants. (Test Valley by age band)
The fastest rise in Hampshire, again
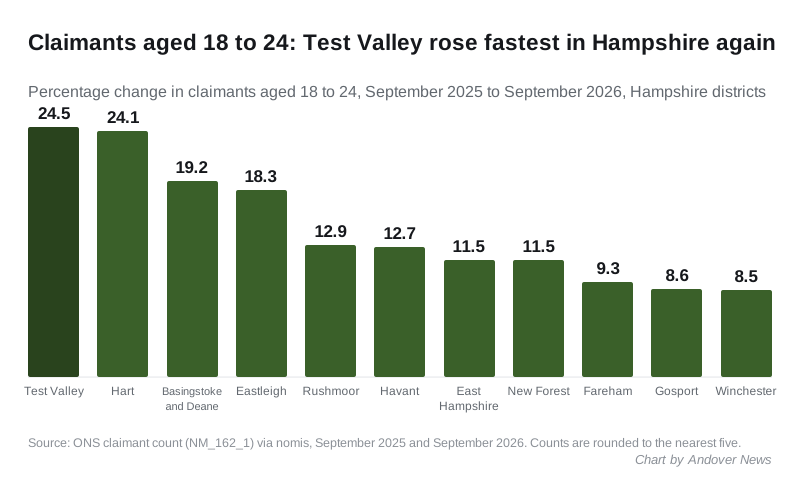
Every Hampshire district had more young claimants than a year ago. Test Valley’s 24.5% rise compares with:
- Hart, up 24.1%, from 145 to 180
- Basingstoke and Deane, up 19.2%, from 625 to 745
- Hampshire as a whole, up 14.3%, from 3,915 to 4,475
- England, up 10.3%, from 271,290 to 299,175
Because local counts are rounded to the nearest five, the gap between Test Valley and Hart is too small to call a clear lead. What is clear is that Test Valley has been at or near the top of this table since July.
The highest since 2021
Test Valley’s 18 to 24 count has climbed steadily for a year:
- 265 in September 2025
- 295 by October 2025
- 315 in February, March and April 2026
- 290 in May and June
- 305 in July, 315 in August and 330 in September
The last time the count was higher was July 2021, at 355, when the borough was still coming down from the pandemic peak of 620 in July 2020. Before the pandemic, in September 2019, it was 185. (Test Valley 18 to 24 series since 2018)
September matters for this age group. It is the first count after school and college leavers who did not go on to study can start to claim, so a rise in the autumn is expected. This one is on top of a year of increases.
Still low overall
On the headline rate, Test Valley sits near the bottom of the Hampshire table. Its 2.0% is matched by Fareham and Winchester, and only Hart is lower, at 1.7%. Gosport is highest at 3.7%, followed by Havant at 3.3% and Rushmoor at 3.0%. (Hampshire districts, claimant rate, September 2026)
August’s figures have been revised
ONS revises the previous month with each release. August’s Test Valley total has been revised down from 1,610 to 1,575, and the 18 to 24 count from 320 to 315. We reported the original figures on 18 September in our August report. On the revised numbers, August did not match August 2021 as we said then; September is now the month that passes it.
What the figure is, and what it is not
- The claimant count is the number of people claiming benefits mainly because they are unemployed. It is not the unemployment rate.
- It combines Jobseeker’s Allowance with Universal Credit claimants who are required to look for work, so it includes some people in low-paid work.
- The count date is the second Thursday of the month, which for these figures was 10 September.
- Local figures are not seasonally adjusted, which is why we compare September with September.
- Counts are rounded to the nearest five, so the age bands do not always add exactly to the total.
(ONS claimant count quality and methodology information)
What it means for you
If you are 18 to 24 and looking for work in Andover or Romsey, there are 65 more people your age claiming than a year ago, so entry-level jobs are more contested. The free starting points are Find a job for vacancies and the National Careers Service for advice and course funding.
If you run a business here, more young people are looking for a first job than at any time since 2021. Test Valley Borough Council’s business grants and support page lists what help is available.
If you follow the numbers, the October figures are due in ONS’s next monthly labour market release in November.
Sources
- ONS claimant count, table NM_162_1 via nomis, September 2026 release, for every figure in this article. Test Valley is local authority E07000093.
- Hampshire districts, 18 to 24 claimants, September 2025 and September 2026.
- Hampshire and England totals.
- ONS claimant count quality and methodology information, for the definitions and the rounding rule.
Earlier reports: August 2026 and July 2026. Also on the local economy: Test Valley house prices.
Have your say